A Python library for creating false-color images from spectral cubes: 3D Numpy arrays with two spatial axes and one spectral axis.
colorsynth collapses the spectral axis into red, green, and blue channels
by mapping the spectrum into the human visible range and weighting it by the
CIE 1931 color-matching functions.
The shape of the spectrum controls the hue of each pixel, and the total
intensity controls its brightness, so features like Doppler shifts are
visible directly in the image.
colorsynth is available on the Python Package Index and can be installed using pip:
pip install colorsynth
Define a spectral cube containing a Gaussian emission line at every point,
with a center wavelength that increases from left to right and a total
intensity that increases from top to bottom, and collapse it into an RGB
image using
colorsynth.rgb():
import numpy as np
import matplotlib.pyplot as plt
import astropy.units as u
import colorsynth

# Define a wavelength grid for the spectral axis
wavelength = np.linspace(400, 700, num=61) * u.nm

# Define a spatial grid
x = np.linspace(0, 1, num=101)[:, np.newaxis, np.newaxis]
y = np.linspace(0, 1, num=101)[np.newaxis, :, np.newaxis]

# Define a spectral cube containing a Gaussian emission line at every point
center = 420 * u.nm + (680 - 420) * u.nm * y
width = 15 * u.nm
spd = x * np.exp(-np.square((wavelength - center) / width))

# Collapse the wavelength axis of the cube into RGB channels
rgb = colorsynth.rgb(spd, wavelength, axis=~0, spd_min=0, spd_max=1)

# Display the result as a false-color image
plt.imshow(rgb)
plt.show()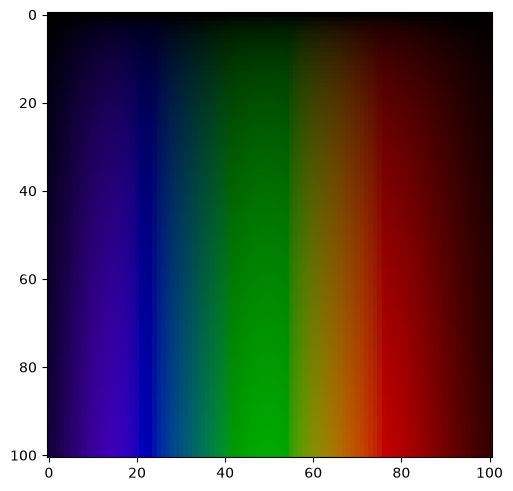
The center wavelength of the emission line appears as hue, and its total intensity appears as brightness.
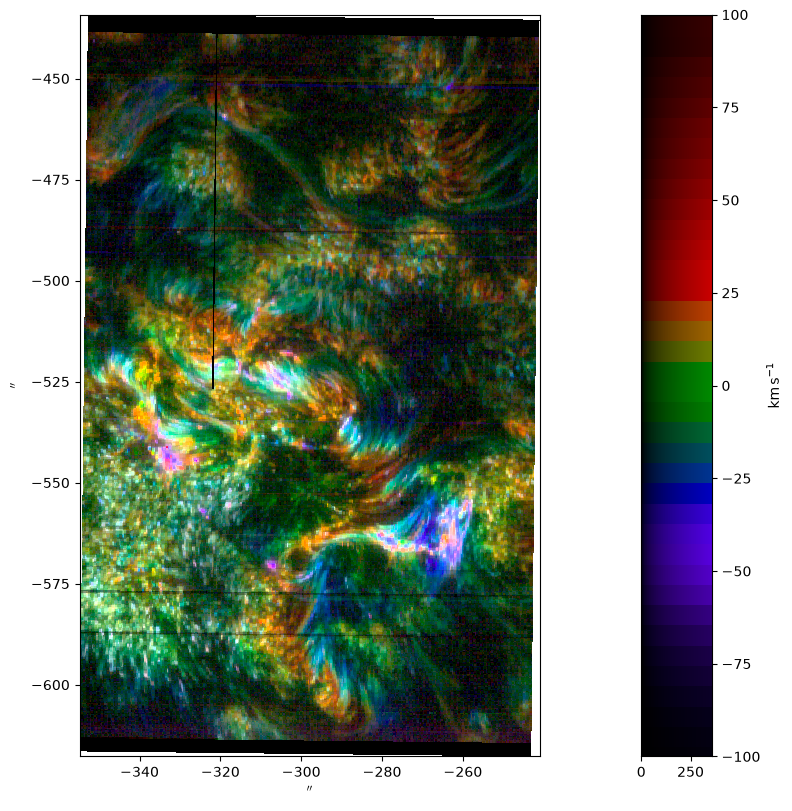
An Si IV 1403 A spectroheliogram captured by the Interface Region Imaging Spectrograph and colorized using
colorsynth.rgb().
The code to create this image can be found in the documentation.