
|

|

See where your AI spend goes.




If CodeBurn shows you something your bill never did, star the repo so other developers find it, and consider sponsoring to keep 41 integrations honest.
npx codeburn
To keep it: npm install -g codeburn or brew install codeburn. Needs Node.js 22.13+.






Desktop app 0.9.25. The macOS builds are signed with a Developer ID and notarized by Apple.
Your bill gives you a month total. It does not break that down by project, by model or by task, and it does not show which part of it was wasted.
Claude Code, Codex, Cursor and the rest each write a session file every time you use them, and those files hold every token and every model call. CodeBurn reads those files and produces the breakdown.
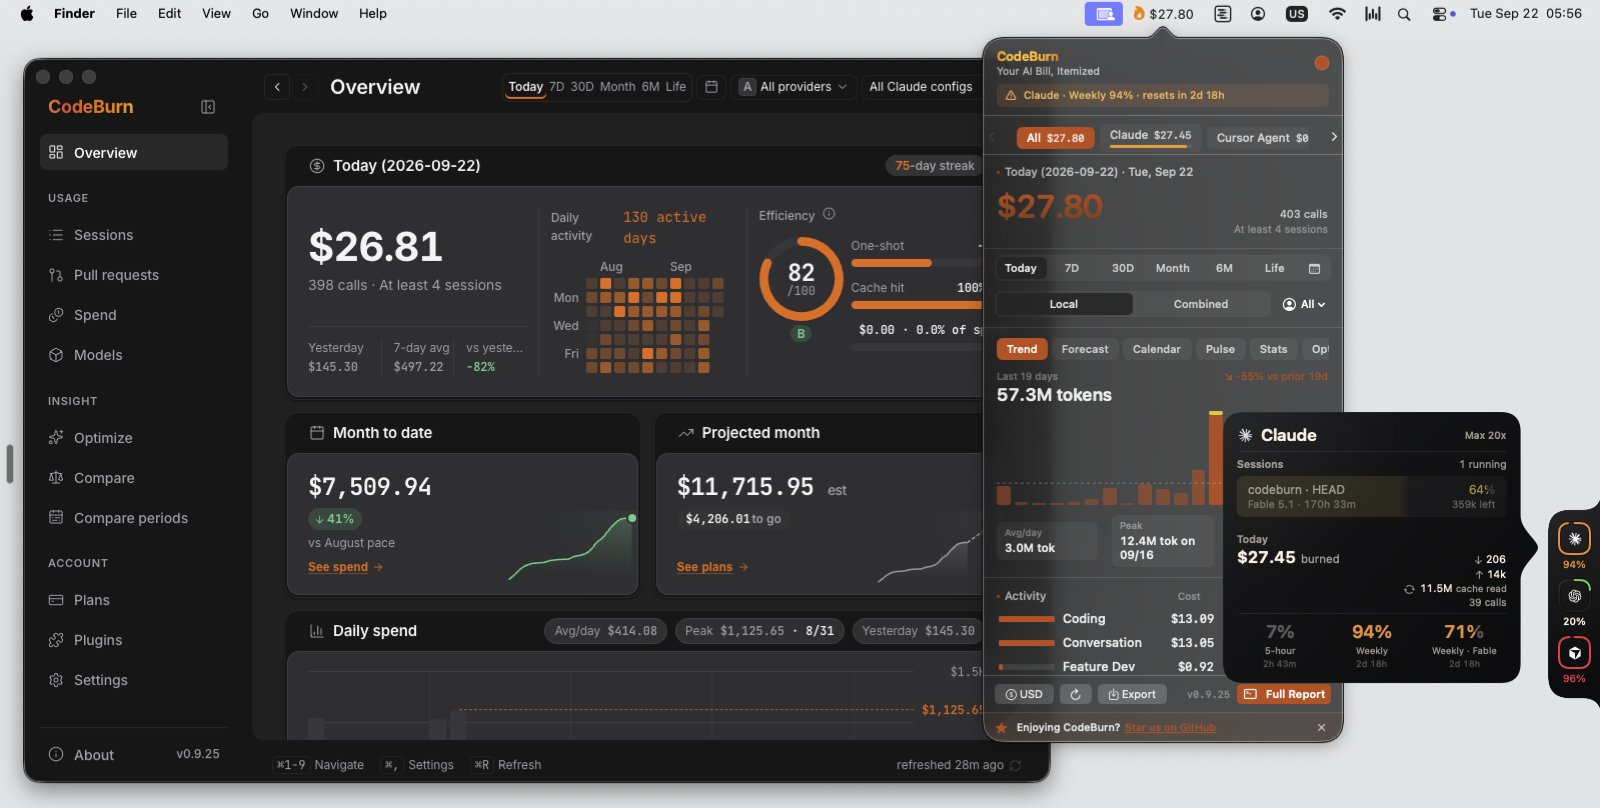
Desktop app, macOS menu bar, Capacity Dock and the Claude glance card, one engine behind all of them.
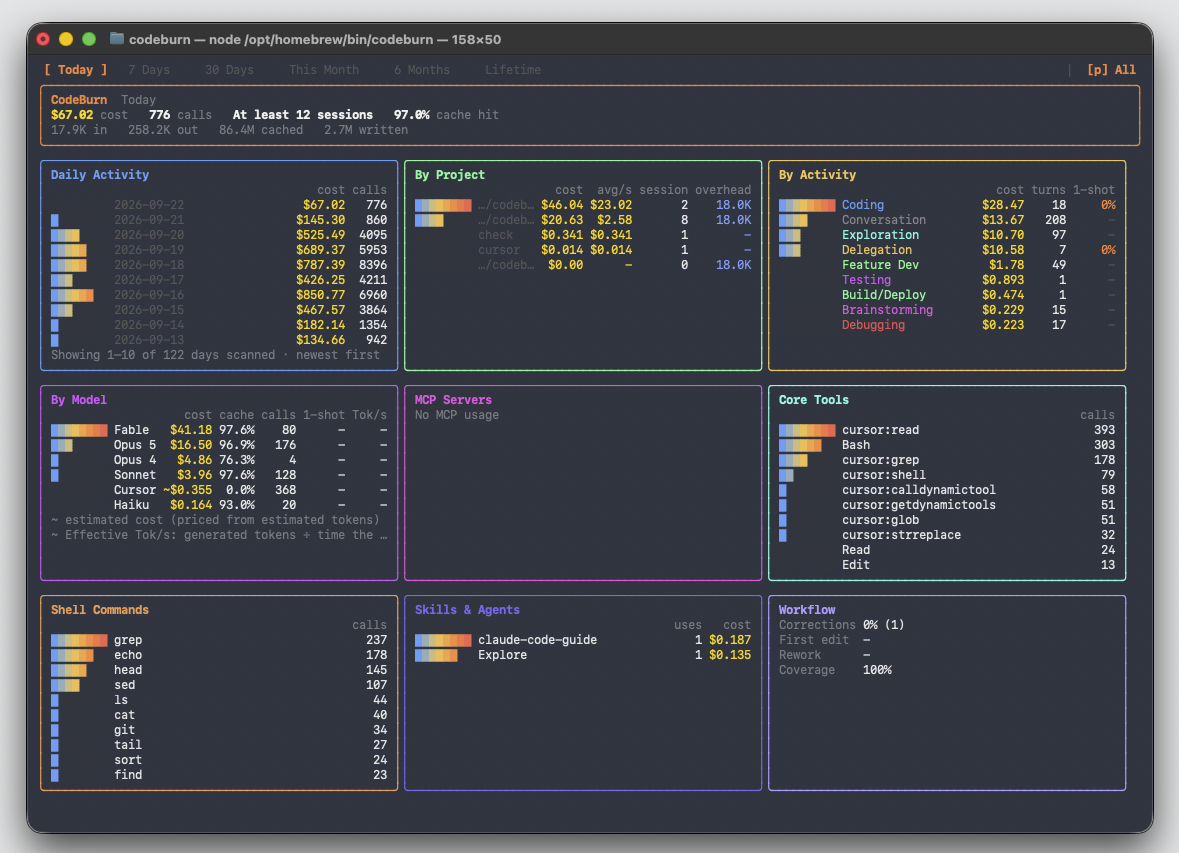
npx codeburnThere is no account and no sign-up. CodeBurn looks in the folders your tools already write to, prices every token, and prints what you spent.
Under the total are the tables: cost by tool, by model, by project and by task. Task means what the agent was doing, such as coding, debugging or planning, worked out from the session itself.
Arrow keys move the period, from today out to your whole history. Press p to switch between tools. Press q to quit.
The desktop app is the same data with room to move around in. It opens on today: what you have spent, what the month is on pace to cost, and the last thirty days day by day.
One click from the clock, the menu bar popover shows the short version of that page. The Capacity Dock adds a ring per provider at the screen edge. Hover a ring and a glance card tells you what is running right now and which limits are filling up.
All four read the same files on your disk, so they show the same numbers, allowing for when each one last refreshed.
The same numbers are in your browser with codeburn web, and in the terminal with codeburn.
Every number in the app is clickable. Click today's total and you land on Sessions, one row per session with its project, its model, its tokens and its cost. Click a row and you get the turns inside it, so you can see which part of the work was expensive.
On the Spend page the same money is cut four ways, by project, by git branch, by model and by task. The branch view adds up every session you ran while you were on that branch, so you get the cost of a feature.
Compare periods puts two date ranges side by side and shows the difference. Use it after you change something, a model or a workflow or a prompt, to find out whether the change actually cost less.
The Pull requests page matches spend against the pull requests your sessions recorded, so you can see which spend shipped (Yield).
codeburn optimizeOptimize reads your sessions and your config, then lists what costs tokens without earning them. A file the agent re-reads on every turn. An MCP server you installed months ago and never call. A CLAUDE.md that grew long enough to ride along in every single request.
Each finding comes with a grade, the fix, and what that fix should save you over the period it scanned.
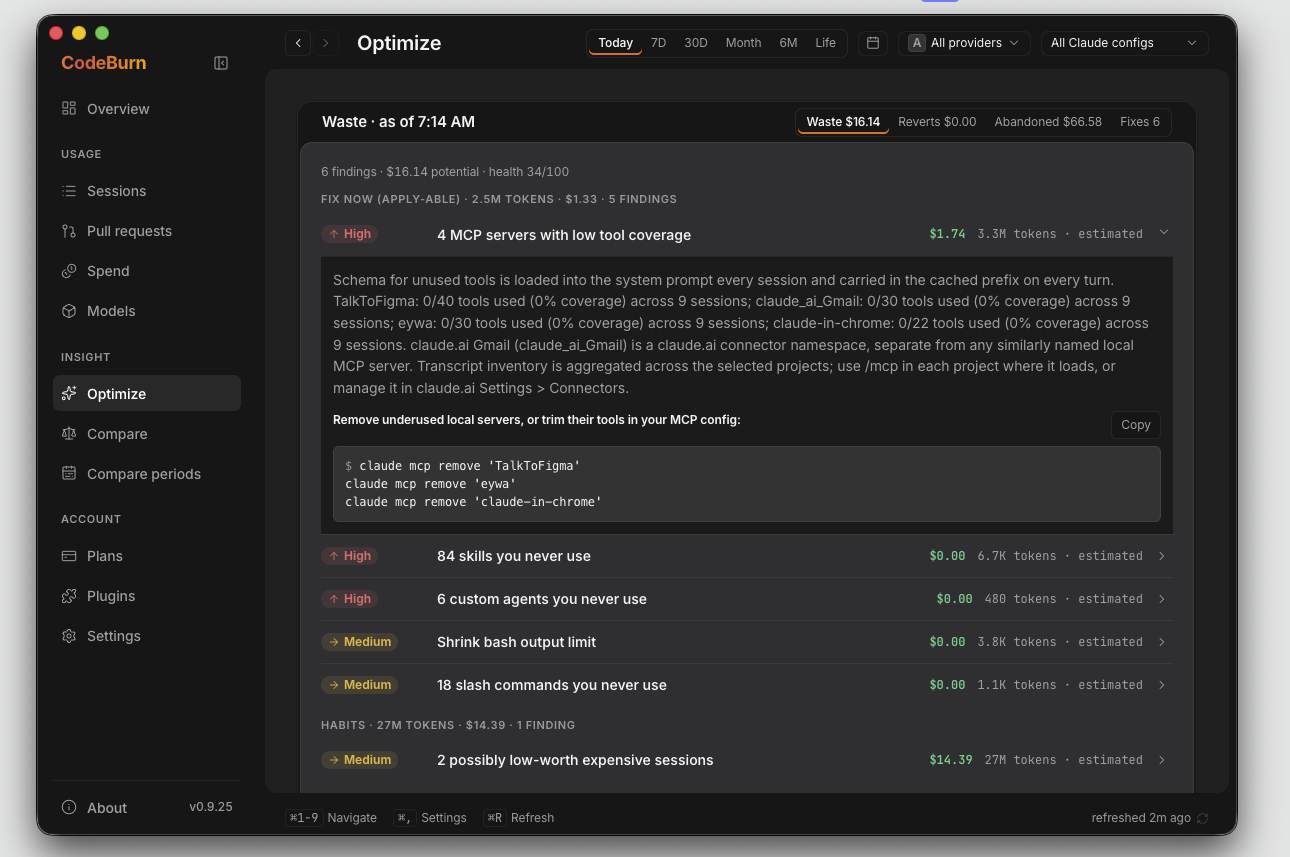
CodeBurn can make the config changes for you, and take them back:
codeburn optimize --apply   # review and apply
codeburn act undo --last    # put it back
Files are backed up before they are changed, and you see the change before anything is applied. A few days later, codeburn act report checks what each fix promised against what your sessions actually did, including the fixes that changed nothing.
codeburn plan set claude-max   # the plan you pay for
codeburn quota                 # how much of it is left
codeburn guard install         # spending caps for Claude Code
Tell CodeBurn which subscription you pay for and it stops showing only what you spent. It shows how much of the plan you have used, and whether the month is on pace to run past it.
codeburn quota reads the live limits out of the tools you are already signed in to. That is where the five-hour and weekly windows come from. Check it before a long run.
Guard is opt-in and local. codeburn guard install adds Claude Code hooks that warn a session once it passes $5 and stop it at $15. Both numbers are yours to change, codeburn guard status shows where the hooks live, and codeburn guard uninstall takes them out again.
Today's spend sits in the macOS menu bar, beside the clock. Click it and the popover opens on the same figures as the app, with today, the period switcher, the trend and the per-model breakdown.
The Capacity Dock docks a thin rail to any edge of your screen, with one ring per provider showing how much of that plan is left. It shows what is left before you start a run, not after.
Turn either on from the desktop app's Plugins page in one click, or from the command line:
codeburn menubarOn Linux the same view lives in the top panel, as a GNOME Shell extension.
The desktop app runs on Windows. Install it from the Microsoft Store, which is the recommended way and keeps itself up to date, or take the direct installer. The Windows tray app shows today's cost next to the clock, the same way the macOS menu bar does, and clicking it opens the same popover. The Capacity Dock is there too, from the tray menu or the app's Plugins page. If you run your agents inside WSL, CodeBurn reads the distro's home directory as well as your Windows profile, so sessions you ran in Linux are counted without you installing anything twice.
Setup for all three platforms, including WSL, is in Menu bar and tray.
claude mcp add codeburn -- npx -y codeburn mcpThat registers a local MCP server over stdio. Your agent can then answer "where did my tokens go this week" or "what should I change to spend less" without you leaving the conversation.
It reads the same files on disk that the CLI reads. The server answers from that local data and makes no network call of its own, and project names are pseudonymized unless the agent asks for them.
CodeBurn detects the tools you already use. There is nothing to configure and no folder to point it at. If a tool is installed and has sessions on disk, it shows up. Each logo links to that tool's page.

































All 41 tools
Each page lists where that tool keeps its data, the format it uses, and the quirks CodeBurn works around.
Antigravity · Claude Code · Cline · Cline CLI · Codebuff · Codex · CodeWhale · Copilot · Crush · Cursor · Cursor Agent · DeepSeek Harness · Devin · Droid · Forge · Gemini CLI · Goose · Grok Bot · Grok Build · Hermes Agent · IBM Bob · KiloCode · Kimi · Kimi Code · Kiro · LingTai TUI · Mistral Vibe · Mux · OMP · Open Design · OpenClaude · OpenClaw · OpenCode · Pi · Qwen · Quick Desktop · Roo Code · Warp · ZCode · Zed · Zerostack
CodeBurn also reads the Vercel AI Gateway reporting API, which is a gateway rather than a tool, so its spend is shown on its own row and left out of your totals by default.
If several of these have sessions on disk, press p in the dashboard to move between them. A path that has changed is worth an issue. Adding a tool is a single file: see src/providers/codex.ts.
CodeBurn reads files that are already on your disk. There is no account, no API key and no proxy in front of your agent.
Your prompts, your code and your project names stay on your computer. CodeBurn does not sit between you and your agent, so if it stopped working tomorrow your tools would not notice.
Prices come from LiteLLM and refresh once a day.
MIT licensed. Development happens in this repo.
Starred by developers at





Keeping 41 integrations working takes constant time. The tools underneath change often, and each change means a config path to follow or a stored format to relearn. Sponsorship pays for that work.

| Page | What is in it |
|---|---|
| Commands | Every command, every flag, every keyboard shortcut |
| How it works | Pricing, task categories, and where each tool keeps its data |
| Optimize | What is scanned, what --apply writes, how to read the grade |
| Menu bar and tray | macOS, Windows (including WSL), and the Linux GNOME extension |
| Plans and quota | Subscription tracking and live provider limits |
| Guard | Budget caps for Claude Code |
| Web dashboard | The browser view, and combining usage across your devices |
| Yield | Which spend actually shipped, correlated against git |
| MCP | The local MCP server and its two tools |
| Configuration | Currency, model aliases, price overrides, environment variables |
| Tools | One page per tool: data location, format, known quirks |
| All docs | The full index |
My spend
I know what the month cost. How much of it was wasted, and how would I know?
Run codeburn optimize. It reads the last 30 days of sessions and your ~/.claude/ config, lists what cost tokens without earning them, and prints a Potential savings line in tokens and dollars for the period it scanned. Findings come in three groups: Fix now, which CodeBurn can apply for you, Habits, which is how you drive the next session, and FYI, which may well be money well spent. Each finding says whether its number is measured from your own token counts or modelled from an average. The setup gets a grade from A to F, and that grade rates the config, not the spending, so an expensive month with a clean setup still scores an A. See Optimize.
Which sessions burn the most, and why?
The desktop Overview and the terminal dashboard both list the five most expensive sessions. Click one in the app and you land on Sessions with the drawer open on it: project, models, tokens, and the per-model, per-category, per-branch and per-day split of that one session. codeburn sessions is the same list in the terminal. codeburn optimize flags sessions that cost more than twice their own project's average. The drawer usually shows the cause, such as one model doing most of the work or one category taking most of the turns. See Drill-through.
My agent spent an hour on a five-minute task. Where did the money go?
Open that session in the Sessions drawer for the per-turn cost, then run codeburn context and pick it from the list. codeburn context prints what filled the context window: assistant split into text, reasoning and tool calls with a row per tool, user split into text, images and compaction summaries, and tool with the tool-result total, which is usually the biggest line. It also counts how many compactions happened, which is the usual sign of an hour spent re-reading. The block sizes are estimated from character counts. The exact context figure comes from the last call's reported usage, and the output labels it as such.
Is Opus worth it, or would Sonnet have done the same job?
Run codeburn compare, or press c in the dashboard, to put two models side by side on your own history: one-shot rate, retry rate, self-correction, cost per call, cost per edit, cache hit rate. Cohorts mode narrows that to the same kind of work, one row per edit turn, with median and P90 cost per edit turn and the sample list you can read yourself. Turns that mixed two models are excluded and counted, never assigned to one. codeburn optimize goes further and prints a Model defaults recommendation when a project has enough edit turns to judge: a cheaper model you already used there whose one-shot rate held up, applied with codeburn act apply-model <project>. See Cohort comparison.
Which project costs the most, and which branch inside it?
Open the Spend page and pick a project in the By branch panel. Each branch row shows its cost, calls, tokens, distinct sessions and activity window, attributed turn by turn, so a session that switched branches lands on both rows with its own slice instead of counting twice. From the terminal the same report is codeburn spend --format branch-json. Branch is recorded per turn by Claude Code and by almost nothing else, so the coverage note under the rows splits the project three ways: spend on named branches, spend before a branch was recorded, and spend from tools that carry no branch at all. See Spend by branch.
Do my subagents cost more than they save?
codeburn sessions --by-work-unit gives one row per orchestration root with its delegated children folded underneath, so the parent and its fan-out read as one number. codeburn models --by-agent splits each model's spend by the Claude subagent that drove it, with main sessions and other tools bucketed under main. The dashboard has a Claude Agent Types panel with calls and cost per agent type, and Delegation is one of the task categories. CodeBurn tells you what the fan-out cost. Whether the same work would have been cheaper in one long session is not something it can measure.
What did that pull request cost me?
The app has a Pull requests page, and codeburn sessions --by-pr is the same report in the terminal. It groups spend by the PR links your sessions recorded, and expanding a row takes you to the sessions behind it. Turns that touched more than one PR contribute their share to each, so the rows are not an exclusive split, and spend tied to no PR is labeled rather than hidden. The links come from what the session wrote down, so CodeBurn never calls GitHub and never checks whether the PR merged. For that part, codeburn yield correlates sessions with commits and sorts the spend into productive, reverted and abandoned, and the Overview's Cost per outcome panel shows cost per commit and cost per productive session. See Yield.
Subscriptions and limits
I pay a flat fee for Claude Max. Why does CodeBurn show me dollars?
The dollar figure is what your tokens would have cost at API rates. It is not an invoice. The card labels it API-equivalent, not a live provider window. It is still the only per-session, per-project, per-model number you can get on a subscription, because a subscription gives you one price and no breakdown. Run codeburn plan set claude-max and the Plans page then shows what you have spent this cycle as a share of the plan, and whether you are on track or on pace to exceed it. See Plans and quota.
I keep hitting my 5-hour or weekly limit. Can I see it coming?
codeburn quota asks each provider how much of your plan is left, signing the request with the credential that tool already stores on your machine. For Claude that is a 5-hour row and a weekly row, each with a percentage used and a reset time, shown as 42% used · resets in 3h 20m on the Plans page's Live quota panel. The Capacity Dock carries the same reading, and the macOS menu bar can carry a second line with quota remaining and its countdown. CodeBurn does not predict the hour you will run out. What you get is how full the window is and when it clears.
Is my plan the right size, or am I paying for capacity I never use?
Set what you pay for with codeburn plan set claude-max, or claude-pro, cursor-pro, copilot-pro, or custom --monthly-usd 200 --provider codex. The Plans page then shows spend this cycle against that budget with a pacing line, either On track or on pace to exceed with the projected figure and the date. After two or three cycles the pattern is clear. Consistently under a quarter of the plan means you are buying capacity you do not use, and consistently over means the cheaper plan is costing you. CodeBurn shows the share and the pace, and leaves the choice of plan to you.
Three tools, three subscriptions. What is my real total?
Plans are stored per provider, so codeburn plan set claude-max, codeburn plan set cursor-pro and a custom Codex plan sit side by side rather than blending into one figure. codeburn plan prints them all, and the app carries one card per active plan with its own spent, percentage and overage. The spend tables stay per tool underneath, so you can see which subscription is carrying the work and which one is idle. Copilot is tracked in AI credits rather than dollars, because credits are what Copilot actually meters.
How my agent works
My agent reads the same file twenty times. How do I see that and stop it?
codeburn optimize has a detector for exactly this, reported as "Claude is re-reading the same files" with the files and what the re-reads cost. Next to it sit reads into node_modules, .git and dist, and sessions that edit far more than they read first. Those two are the ones a written rule can fix: codeburn optimize --apply appends a marker block to the current project's CLAUDE.md, shows you the file before it writes, and backs it up under ~/.config/codeburn/actions/. codeburn act undo --last puts it back. The re-read finding itself has no file to edit, so the fix there is how you open the next session.
How much of my context is tool output, and what is it costing me?
Run codeburn context and pick a session. It works for Claude Code and Codex, and gives you a tree: assistant split into text, reasoning and tool calls with a row per tool, user split into text, images, compaction summaries and meta, then tool with the tool-result line, and system. The headline shows the exact context size from the last call's usage next to the model's window. The tree counts tokens rather than dollars, because that context is re-sent every turn and its price depends on how much of it came from cache. For the dollars over a period, codeburn models prices the same sessions.
Which MCP servers and skills am I paying for but never using?
codeburn optimize compares what is configured against what was actually invoked. It names MCP servers configured but never called, servers with many tools and almost none used, and skills, agents and slash commands that are defined and never invoked. An MCP server's tool schemas ride along in the prompt whether you call it or not, so an unused one costs tokens on every turn. codeburn optimize --apply removes the server entry from ~/.claude.json or the project's .mcp.json, and moves unused skills into ~/.claude/skills/.archived/ rather than deleting them.
How often does my agent actually get it right first try?
The one-shot rate. It is the One-shot figure on the app's Overview, a column in the dashboard's activity table, and a per-model row in codeburn compare. A retry is counted when the same file is edited again after a shell command ran in between, which is the shape of an edit that did not work. Editing a different file after a shell step is not a retry. Coding at 90% means nine edit turns in ten needed no second pass. File-level tracking works for Claude, Codex and Goose. Other tools fall back to tool names, so their figure is rougher. See How it works.
How does CodeBurn know a session was coding rather than debugging or planning?
From the tools the session used and the words in your own messages, with no model call anywhere. Edit and Write make it Coding. Error and fix words alongside tool use make it Debugging. pytest or vitest in a shell command makes it Testing. Read and Grep with no edits make it Exploration, and the Agent tool makes it Delegation. There are 13 categories and the rules are deterministic, so the same session always lands in the same category. The full table is in How it works.
Trust the numbers
On a subscription the dollars are an estimate. What is estimated and what is measured?
The tokens are measured for most tools. Claude Code, Codex, Gemini, Zed, OpenCode and others write real per-call input, output and cache counts into their own session files, and CodeBurn reads those rather than guessing. The price applied to them is published API pricing, so the dollar figure is arithmetic on measured tokens, not a guess about your bill. A few tools record no counts at all, so Cursor, Kiro and some Copilot sessions are estimated from content length, and those are marked estimated in the tables. codeburn audit prints a row per provider and model saying where every number came from.
Where do the prices come from, and what if a vendor changes them?
From LiteLLM, fetched and cached for 24 hours under ~/.cache/codeburn/, so a change reaches you within a day of LiteLLM picking it up. The common Claude and GPT models also carry bundled fallback prices, so a lookup miss falls back to a known rate for those. Anything else shows as unpriced rather than guessed. If a model shows $0 its name matched no price row. codeburn models --unpriced lists those ids, codeburn model-alias points a proxy-rewritten name at the real model, and codeburn price-override sets exact rates yourself. A session is priced with today's rates when it is read, not with the rates of the day it ran. See Configuration.
Claude Code deletes its sessions after 30 days. Does my history go with them?
The daily numbers do not. CodeBurn keeps a durable daily history under ~/.cache/codeburn/, holding each day's cost, tokens and per-project and per-model split for ten years, so codeburn report and codeburn status keep answering for days whose transcripts are gone. The per-session detail does go, because it only ever lived in the transcript. So anything that reads sessions, codeburn sessions, models, spend and compare-periods, will show less for an old range than report does for the same range. Compare periods lists those days by name with their unexplained amount instead of quietly folding them into the totals.
What actually leaves my computer, and how can I check?
Model prices are fetched from LiteLLM and cached for 24 hours, so that call happens at most once a day. codeburn quota asks each provider you are signed in to how much of your plan is left, using the credential that tool already stores on your machine. If you set a non-USD currency, exchange rates come from Frankfurter, cached the same way. Commands that install something, such as codeburn menubar, reach GitHub releases, which is the point of them. Your prompts, your code, your file names and your project names are read on disk and never sent anywhere, and nothing else leaves unless you point CodeBurn at a destination yourself. It is not a proxy, so no traffic of yours passes through it. You can watch what does leave with a network monitor.
Everything else
I work on a laptop and a desktop. Can I get one number across both?
Yes, on the same local network. On the second machine run codeburn share --pair, which opens a pairing window and prints a PIN. On your main machine run codeburn devices add to find it and pair with that PIN, then codeburn devices shows combined totals by machine. codeburn devices rm <name> forgets one again. Sharing stops after ten minutes idle unless you pass --always, and pairing never leaves your network. You can also discover and pair from the browser dashboard at codeburn web. See Web dashboard.
Can my agent read these numbers itself, without me leaving the conversation?
Register the local MCP server with claude mcp add codeburn -- npx -y codeburn mcp. It runs over stdio and exposes two tools: get_usage for spend and usage broken down by tool, model, project and task, and get_savings for the waste findings, retry tax and routing waste, which is the slower of the two. Any MCP client works, with command npx and args -y codeburn mcp. It reads the same files on disk the CLI reads, and project names are pseudonymized unless the agent asks for the real ones. See MCP.
Why is this free, and what is going to cost money later?
CodeBurn is MIT licensed and all of it is in this repository: the CLI, the desktop app, the menu bar and tray apps, the GNOME extension. There is no account, no paid tier and no feature held back for one. It is free because it reads files you already have, which costs nothing to run. What it does cost is time, because 41 integrations sit on top of tools that change their config paths and data formats without warning. Sponsorship is what pays for keeping up with them.
What the desktop app sends, and how to turn it off
The CLI sends nothing. No wrapper, no proxy, no phoning home.
The desktop app and the Windows tray can send an anonymous usage report, and only after you decide on the first-launch consent screen. The toggle defaults to off in the EU, EEA, UK and Switzerland, and anywhere the region is unknown; on elsewhere. Either way it is your call, and you can change it any time in Settings > Privacy & data > Anonymous telemetry. Turning it off stops all sending, clears anything queued, and mints a fresh install id so past and future reports cannot be linked.
The only identifier is a random id generated on your machine. Events carry the calendar day, never a clock time. Alongside each batch go the app version, platform, architecture and country.
usage_snapshot goes out at most once per calendar day. It is computed by the CLI so the app
and the tray report the identical shape, and every magnitude in it is a bucket, never an exact
figure. The daily report includes the names of the models, tools, skills and MCP servers you use,
alongside those bucketed counts.
| Field | What it carries |
|---|---|
schema, period |
Snapshot version, and the period label you were looking at (for example 30 Days) |
providerCount, costBucket |
How many providers had usage, and total spend as a range: <1, 1-10, 10-50, 50-200, 200-1k, 1k+ USD |
models |
Up to 8 model names, each with its cost bucket, turn-count bucket, one-shot rate, and up to 6 task categories with a turn bucket and share of that model's turns |
categories |
Up to 12 task category names (Coding, Debugging, Planning, …) with a turn bucket, one-shot rate, and up to 3 model names |
providers |
Up to 8 provider names with a cost bucket each |
mcpServers, skills, tools |
Up to 12 names each with a call-count bucket: 0, 1-10, 10-100, 100-1k, 1k+ |
sessions |
Session count bucket, and median session length as a bucket: <5, 5-15, 15-60, 60-240, 240+ minutes |
efficiency |
Cache hit rate and retry tax as shares of the total, to two decimals |
The other events are name-only:
| Event | Fields |
|---|---|
app_open, app_close |
Session length in whole minutes |
section_view |
Which section you opened (overview, spend, …) |
cold_start |
Milliseconds to the first painted overview, and whether it timed out |
cli_error |
Error kind and the command name, capped at 20 per kind per day |
optimize_apply |
The finding id you took a fix for (unused-mcp, claude-md-too-long, …) and the fix type |
plan_set |
Provider and plan preset id |
export |
Format (csv or json) and provider |
compare_view |
The two model names being compared |
settings_change |
Setting name and its new boolean or enum value |
Never collected: prompts, code, file contents, file or folder names, project names, branch names, working directories, session titles, PR links, API keys, exact dollar amounts, exact counts, clock times, or IP-based location beyond the country. The names of the models, tools, skills and MCP servers you use are collected, as the table above sets out, and a whitelist sanitizer drops anything that is not a short string, a finite number or a boolean before it leaves the machine.
To turn it off: decline on the consent screen, or open Settings > Privacy & data and switch Anonymous telemetry off.
MIT.
CodeBurn is an AgentSeal open-source project and is not affiliated with CodeBurn Bt. or codeburn.hu.
Pricing data from LiteLLM. Exchange rates from Frankfurter.
Built by AgentSeal.
The Capacity Dock's provider-usage tracking was informed by CodexBar by Peter Steinberger (@steipete), an MIT-licensed menubar app for AI provider usage. Thanks.