

Bleemeo is a European SaaS company headquartered in Toulouse, France, building modern monitoring for servers, containers, and applications. Our platform is designed to be simple to deploy, predictable to bill, and built around data residency in the EU — a fit for startups, scale-ups, and regulated industries (healthcare, finance, public sector) operating under GDPR, NIS2, or DORA.
We build the SaaS product at bleemeo.com and maintain the open-source projects below. Everything you see on this organization is licensed under Apache 2.0.
- Bleemeo SaaS — Cloud monitoring with auto-discovery, predictable per-host pricing, AI-assisted alert correlation and noise reduction, and EU data residency.
- Glouton — Our open-source monitoring agent. Collects metrics and logs from servers and containers, auto-discovers services, and runs standalone or with the Bleemeo platform.
- Dashglass — New — Lightweight Prometheus-native dashboards with first-class GitOps: one Go binary, dashboards stored as git-friendly files, edited in the UI.
- SquirrelDB — Scalable time-series database backed by Cassandra, with a Prometheus-compatible API.
- SDKs — Go and Python clients for the Bleemeo API.
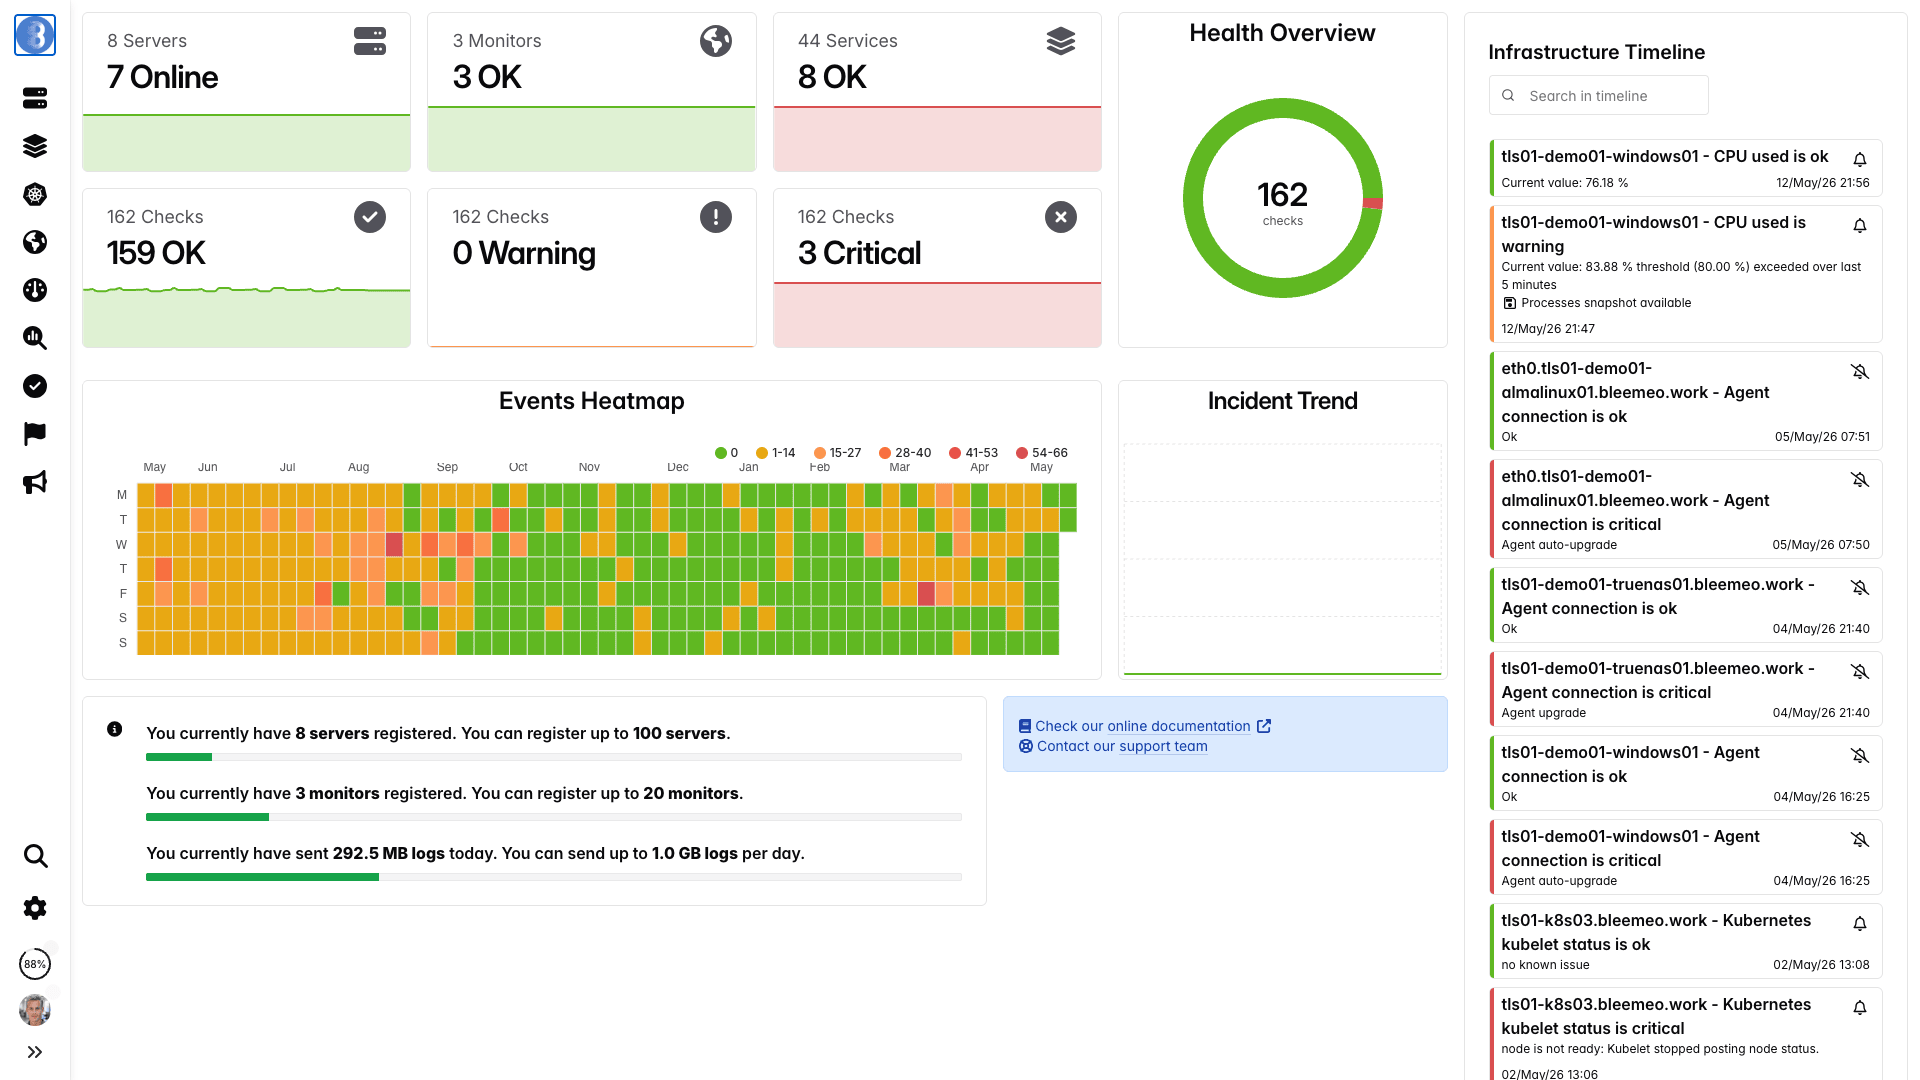
A glimpse of the Bleemeo Cloud dashboard — fleet health at a glance, with full incident context one click away.
Dashglass is our newest open-source project: the dashboard part of Grafana, nothing else. A single Go binary, no database, and every dashboard is a plain JSON/YAML/TOML file you can version, review, and deploy through git.
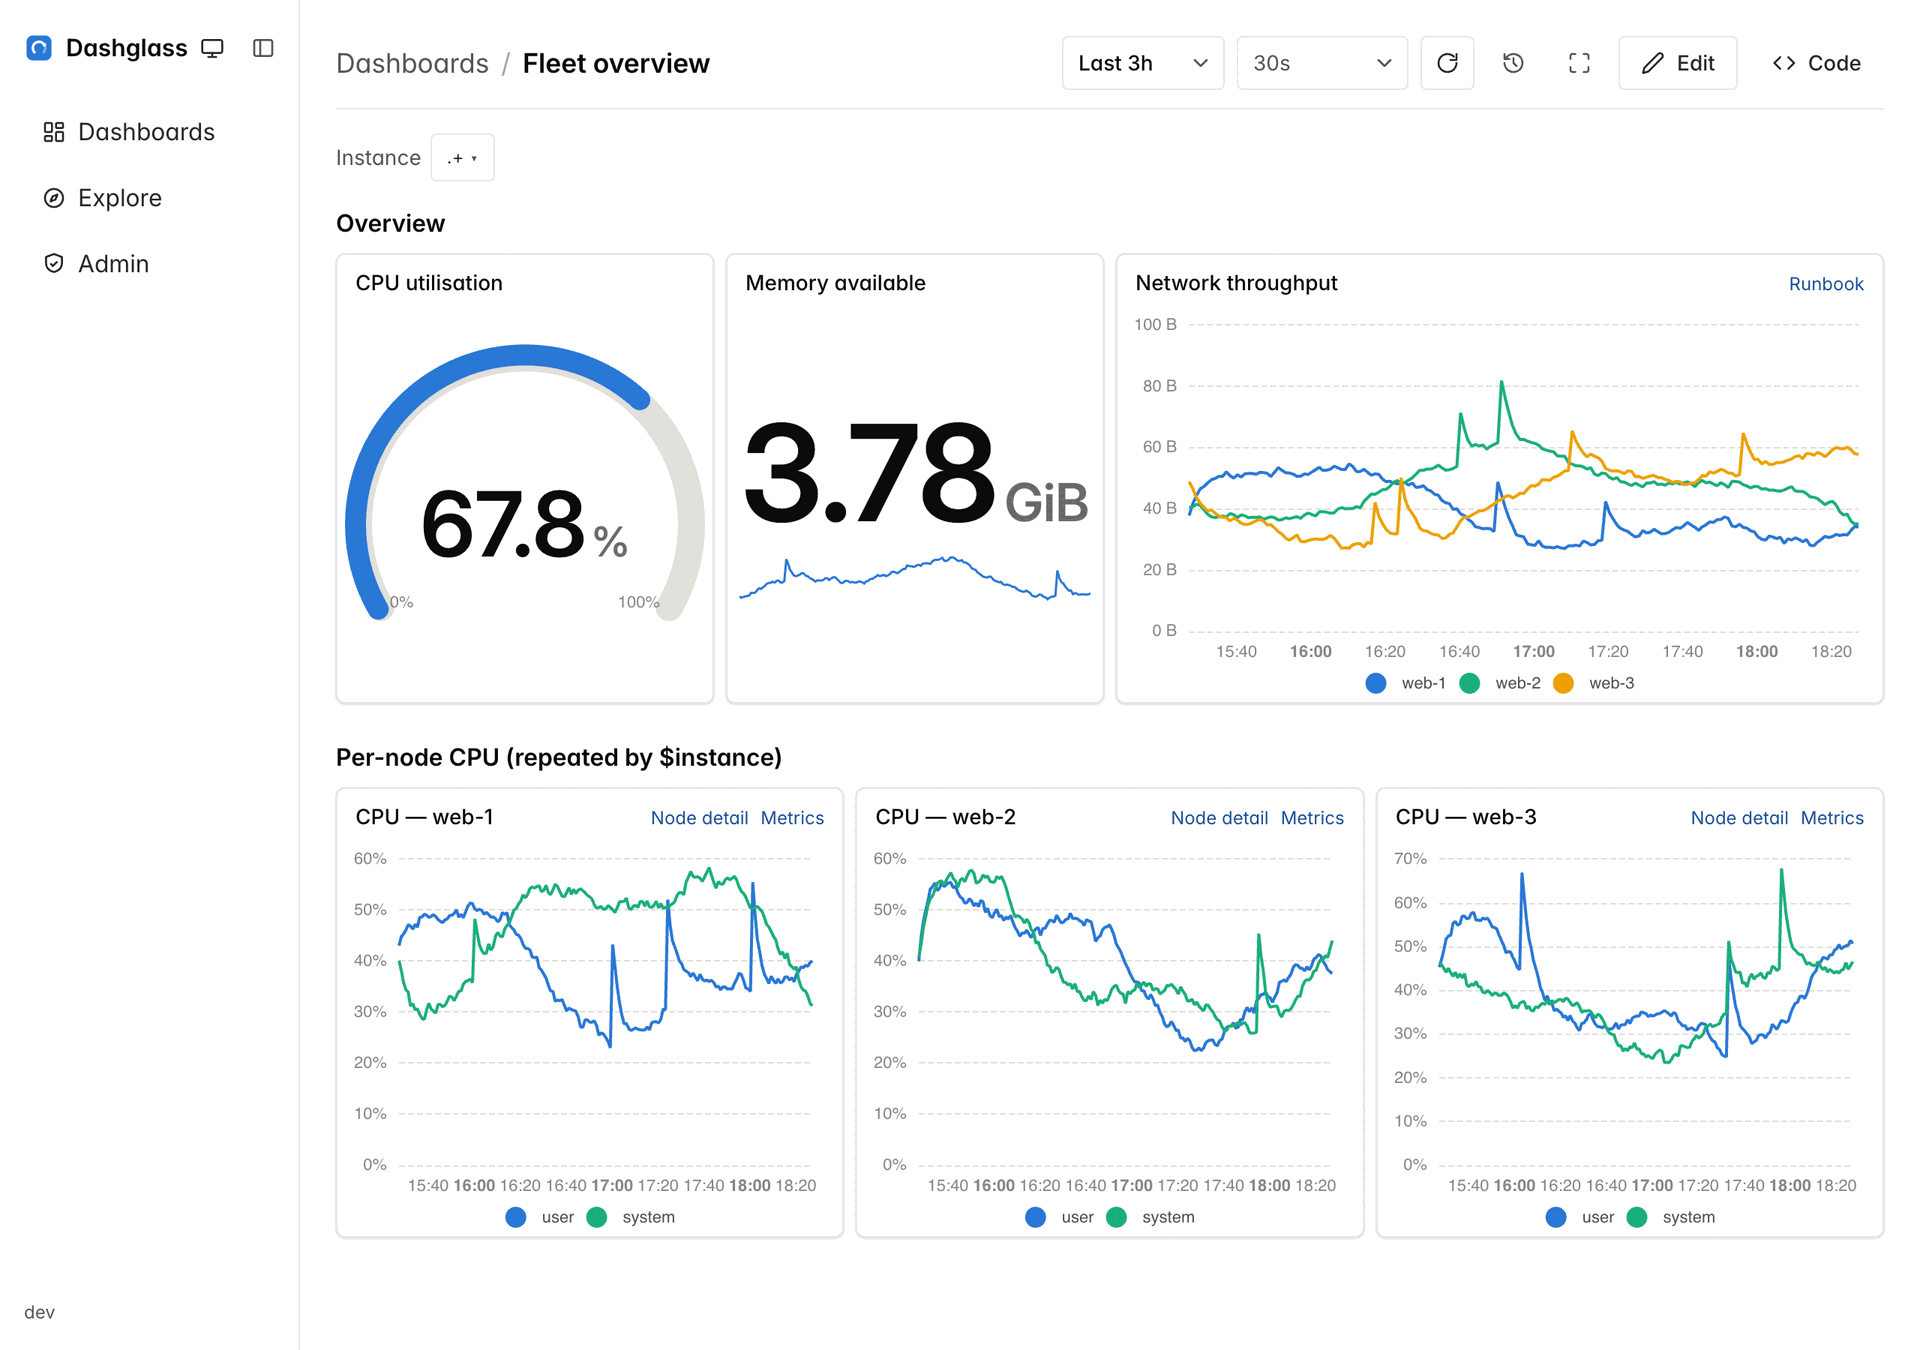
- Files are the product — deterministic serialization, so a one-field edit produces a one-line diff. Edit in the UI, review in git, or run fully provisioned with
-readonly. - Git-native history — browse, diff, and restore dashboard versions straight from the UI, backed by
git log. Optional commit-on-save and push/pull sync with a remote close the GitOps loop. - Prometheus-native — read-only proxy to your Prometheus, a PromQL editor with live autocompletion, an Explore view, and chained dashboard variables.
- Interactive — repeat a panel across the values of a variable, and drill down to another dashboard or an external tool with the current variables and time range carried over.
- Grafana import — convert dashboards from a JSON export or straight from grafana.com, with honest per-panel warnings.
Point it at a Prometheus and a dashboards directory:
docker run -p 8080:8080 -v "$(pwd)/dashboards:/dashboards" \
  ghcr.io/bleemeo/dashglass -prometheus-url http://your-prometheus:9090
# open http://localhost:8080
Prebuilt binaries for Linux, macOS, and Windows are attached to each release. No Prometheus at hand? The repository ships a Docker Compose demo with sample dashboards that have data out of the box.
| Project | What it does | Language |
|---|---|---|
glouton  |
Monitoring agent — metrics, logs, service auto-discovery | Go |
dashglass  |
Prometheus-native dashboards stored as git-friendly files, with GitOps history | Go, TypeScript |
squirreldb  |
Time-series database with a Prometheus-compatible API, backed by Cassandra | Go |
squirreldb-ingestor  |
Ingestion service in front of SquirrelDB | Go |
bleemeo-go  |
Go client for the Bleemeo API | Go |
bleemeo-python  |
Python client for the Bleemeo API | Python |
bleemeo-community-edition  |
Self-hosted Bleemeo edition for the community | — |
All projects are released under the Apache License 2.0.
Get the platform running in a few minutes — no infrastructure to deploy on your side.
- Start a free trial of the SaaS — bleemeo.com/trial/
- Read the docs — docs.bleemeo.com
Spin up Glouton on any Linux host with Docker — no Bleemeo account needed. It auto-discovers services running on the host and exposes a Prometheus-compatible metrics endpoint:
docker run -d --name=bleemeo-agent --pid=host --net=host \
  --cap-add SYS_PTRACE --cap-add SYS_ADMIN \
  -v /var/lib/glouton:/var/lib/glouton \
  -v /var/run/docker.sock:/var/run/docker.sock \
  -v /:/hostroot:ro \
  -e GLOUTON_BLEEMEO_ENABLE=false \
  bleemeo/bleemeo-agent
For Kubernetes, native Linux packages, or Windows installers, see the Glouton README.
We welcome pull requests, issues, and feedback on every open-source project here.
- Start with the Contributing guide — it covers commit conventions, DCO sign-off, and PR expectations.
- Check the project's own README for build, test, and lint commands.
- All contributors are expected to follow the Contributor Covenant 2.1.
Need help instead? See SUPPORT.
Found a vulnerability? Please don't open a public issue.
Use GitHub's private vulnerability reporting on the affected repository, or email security@bleemeo.com. Full policy: SECURITY.md.
- Website — bleemeo.com
- Docs — docs.bleemeo.com
- Service status — status.bleemeo.com
- LinkedIn — linkedin.com/company/bleemeo
- X — @bleemeo
- Bluesky — @bleemeo.com
Built in Europe — Running in Europe · © Bleemeo SAS


